HydroView
Cloud Based SoftwareHydroView is a powerful cloud-based software platform designed to collect, store, and analyze data from remote hydrometeorological monitoring stations. Engineered to work with both Geolux dataloggers and third-party devices, HydroView provides a centralized solution for managing all aspects of hydrological data, from real-time monitoring to in-depth analysis and alarm management.
Once environmental data is transmitted from remote dataloggers, HydroView automatically stores it in a secure internal database, ensuring that all historical and current data is readily accessible. The platform’s intuitive user interface allows users to easily view and analyze this data, providing insights into water levels, river discharges, water temperatures, and other critical hydrological parameters.
HydroView offers powerful analytical tools, enabling users to visualize data trends, generate reports, and make informed decisions based on accurate and up-to-date information. Users can set custom alarms to receive notifications when specific thresholds are met, ensuring timely responses to critical changes in environmental conditions. This feature is particularly valuable for early flood warning systems, water resource management, and infrastructure protection.
The cloud-based nature of HydroView means that users can access their data from anywhere with an internet connection, providing flexibility and convenience for monitoring and managing hydrological systems remotely. Additionally, the platform supports multiple user accounts with customizable access levels, ensuring that team members can collaborate effectively while maintaining data security. For enterprise users, Geolux also offers HydroView as an on-premise installation software package.
The core function of HydroView is the acquisition of data from remote sites monitoring various hydrometeorological parameters. HydroView supports a range of data transfer protocols, such as HTTP and FTP. Additionally, the extensible HydroView interface allows the platform to pull data from LoRaWAN gateways and satellite system gateways, enabling integration with equipment that uses LoRaWAN or satellite data transfer. These protocols are compatible not only with Geolux dataloggers, such as SmartObserverPlus, but also with a wide variety of third-party dataloggers, ensuring flexibility and broad compatibility.
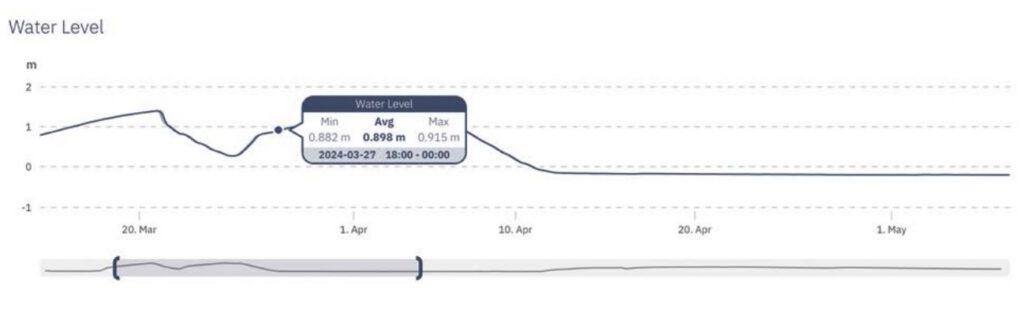
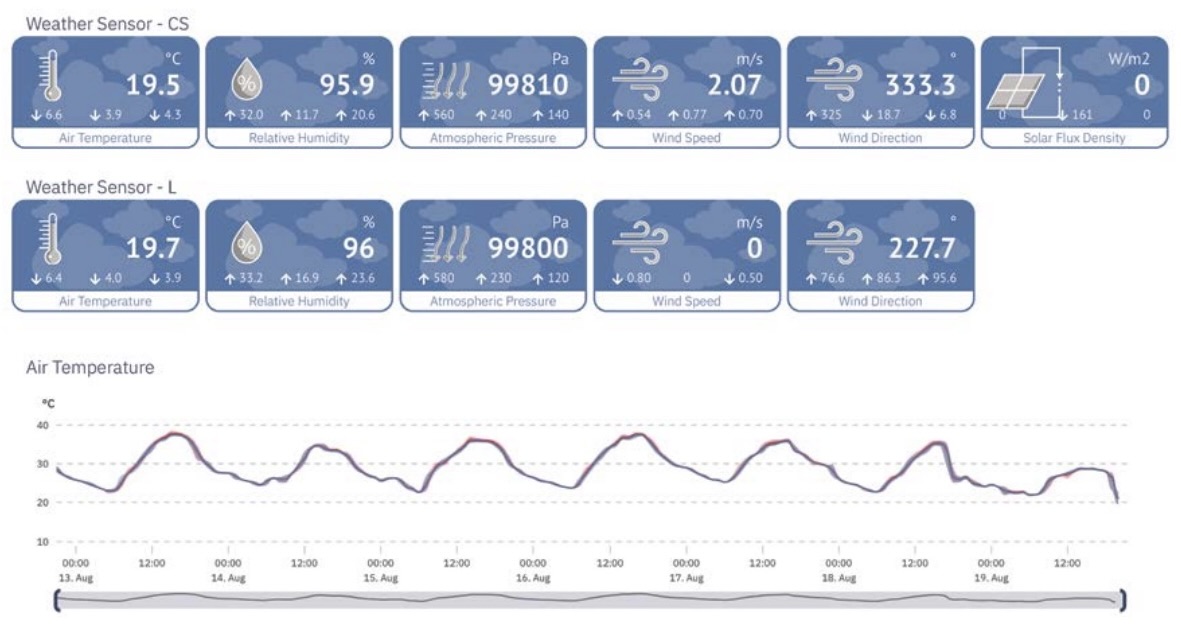
Data visualization is a key feature of HydroView, designed to present measurement data in a clear and intuitive manner. The graphs are optimized for clarity, making it easy to interpret visual information at a glance. Zooming in and out on these graphs is intuitive, with UI components specifically developed for fast response and precise visualization. Users can easily view exact data values through popups and select specific time ranges for detailed data analysis.
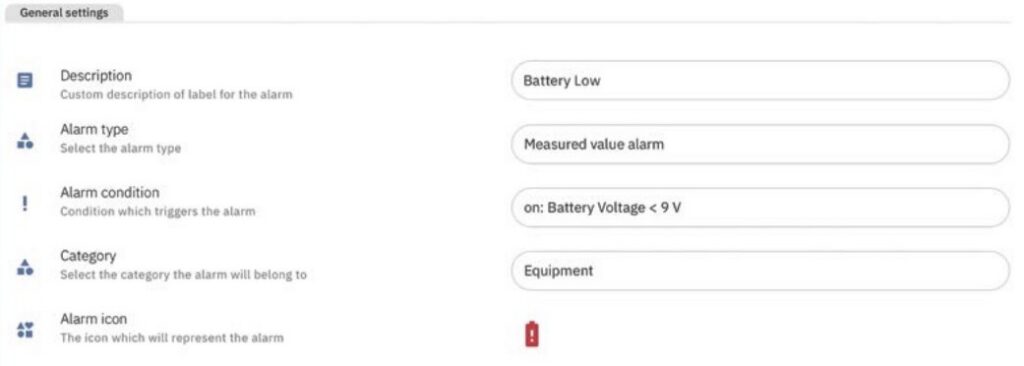
HydroView allows users to define customized alarms for one or more monitored parameters at each monitoring site. These alarms can be organized into categories, enabling users to subscribe to specific alarm categories relevant to their responsibilities. For example, at a water level monitoring site, you could set up two distinct alarms: one that triggers when the water level rises too high and another for when the battery voltage drops too low. A user responsible for flood management can subscribe to the high water level alarm, while a maintenance technician might subscribe to the low battery alarm. Alarms can be distributed via email or SMS.
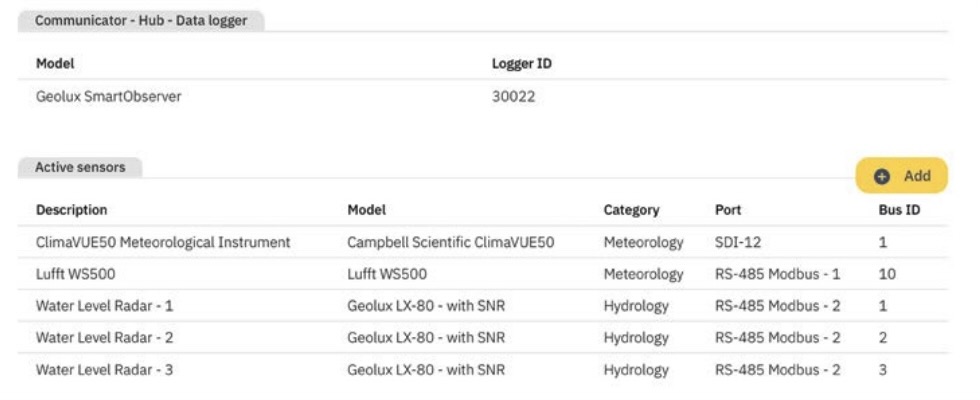
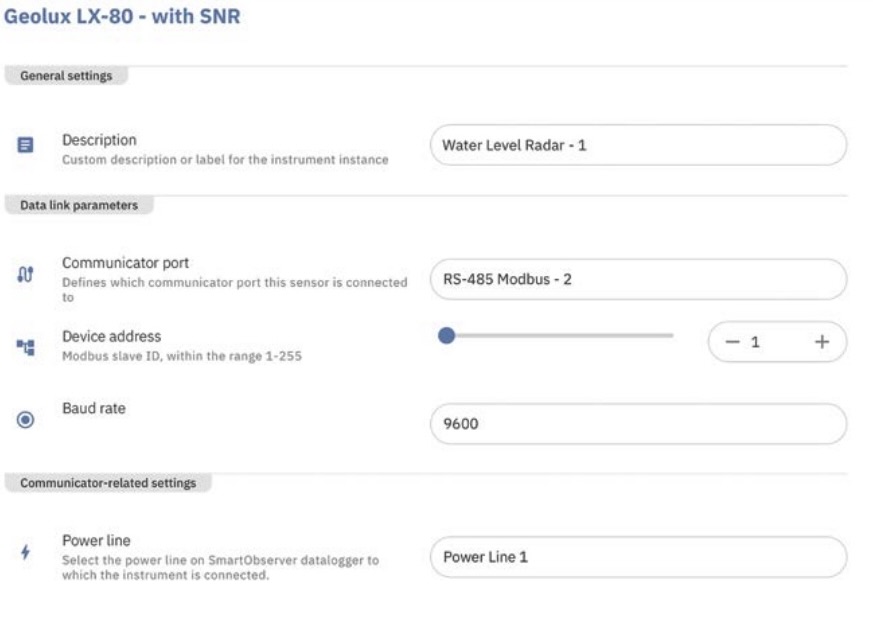
When paired with Geolux SmartObserver and SmartObserverPlus dataloggers, HydroView offers advanced remote equipment management functionality. Users can configure all datalogger parameters directly through the HydroView interface, including defining which measurement instruments are connected to the datalogger, without the need of having physical connection to the datalogger hardware.
The system also allows for over-the-air (OTA) firmware updates, ensuring that all equipment remains up-to-date without the need for on-site visits. Additionally, HydroView provides automatic system health monitoring, giving users real-time insights into the status of their equipment. This integration of HydroView with SmartObserver dataloggers creates a fully remote IoT system, offering complete management and configuration capabilities from within the HydroView user interface.
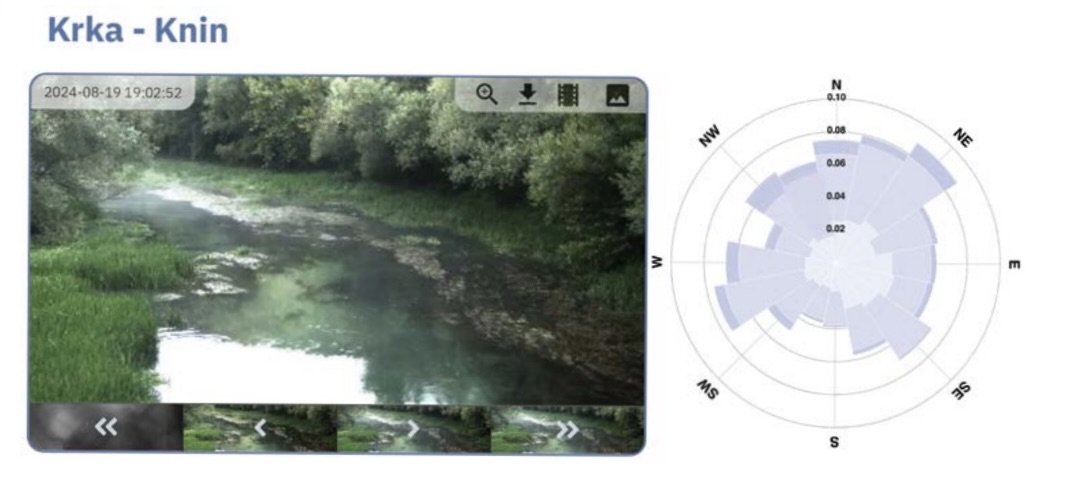
HydroView allows users to create fully customizable screens that display monitored parameters in a variety of formats, including gauges, graphs, and wind rose visualizations. These custom dashboards offer flexibility in data presentation and can be custom-tailored. Users have the option to keep these dashboards private, share them with others who have data access privileges within a specific group, or make them publicly accessible, allowing anyone without a HydroView account to view the data. The intuitive user interface makes it easy to customize and configure these reports.
HydroView offers flexible options for connecting to third-party systems and sharing data, making it easy to export information for use in external analysis tools and software. Users can manually export data by downloading it in CSV or Excel format, which can then be imported into other applications for further analysis.
For automated data exchange, HydroView provides four different methods:
- HTTP Pull: Third-party software can connect to HydroView via HTTP(S) API using a secure authentication key to retrieve specific data.
- HTTP Push: HydroView can periodically push the latest measurements to third-party software through an HTTP(S) API.
- FTP Pull: Users can connect to HydroView via FTP, authenticate with a username and password, and explore stored data using FTP protocol.
- FTP Push: HydroView can initiate an (S)FTP connection to a third-party (S)FTP server,
automatically pushing new measurement data as it becomes available.
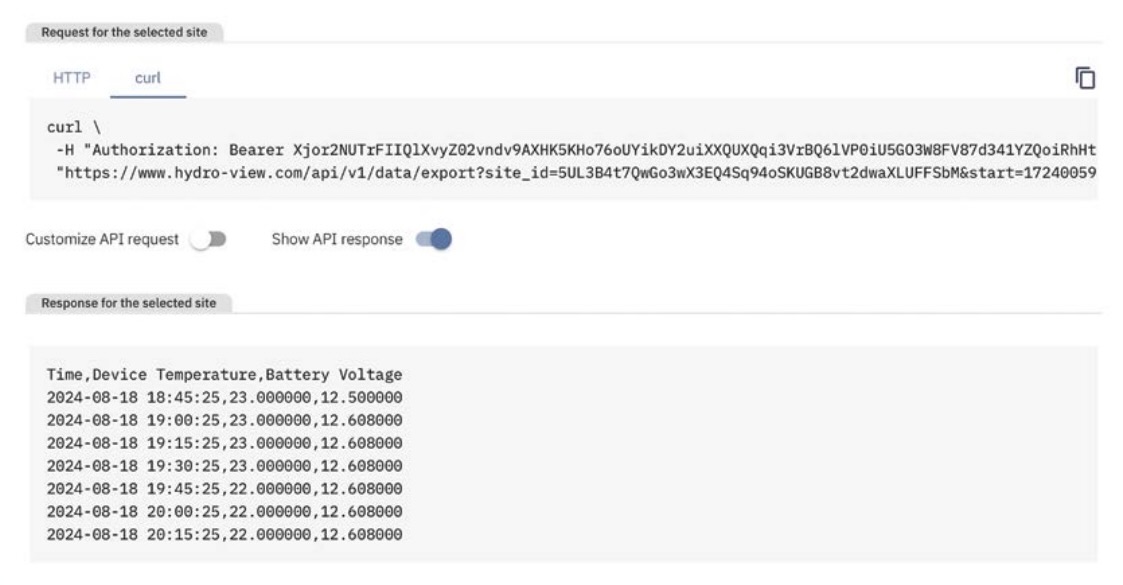
The HTTP Pull method is straightforward. Using the HydroView interface, users need to generate a secure API token, which is required for all HTTP API requests. Two API endpoints are provided, with interactive API documentation available directly within HydroView.
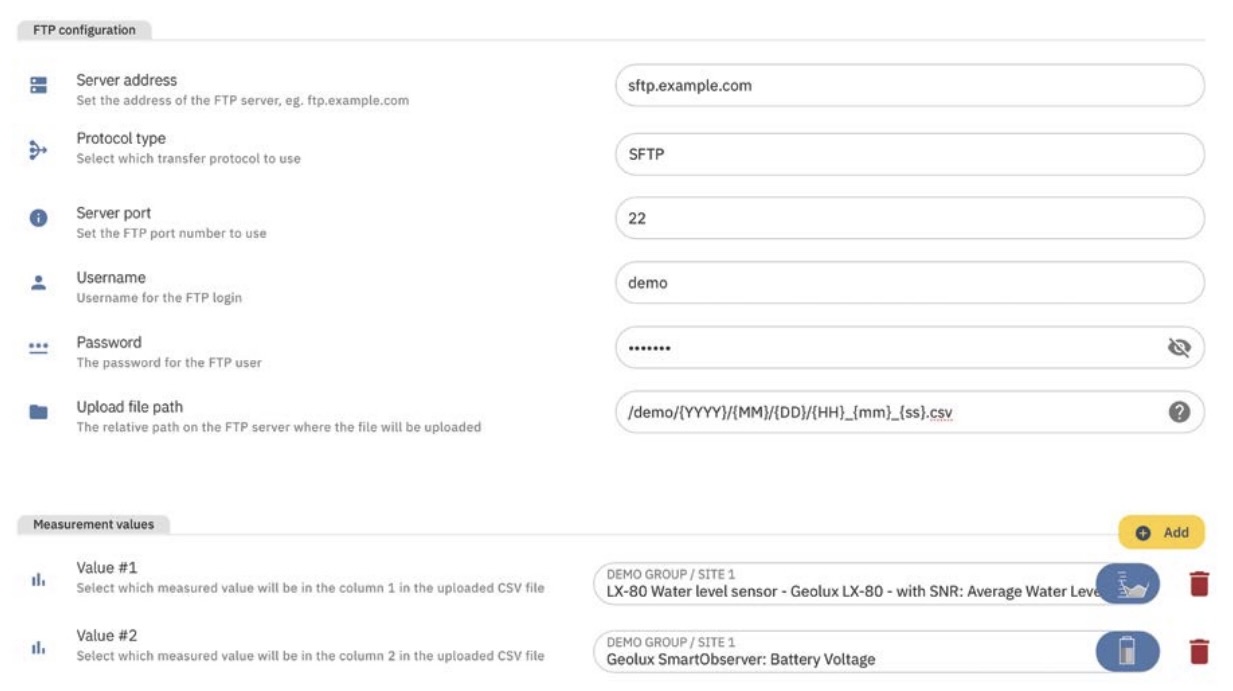
When using the FTP Push data export method, users are required to configure FTP server parameters, including the server address, username, password, and upload file path. The upload path is highly customizable with various wildcards, allowing users to generate filenames based on the current date and time. Additionally, users must select which data measurements will be transmitted to the FTP server.
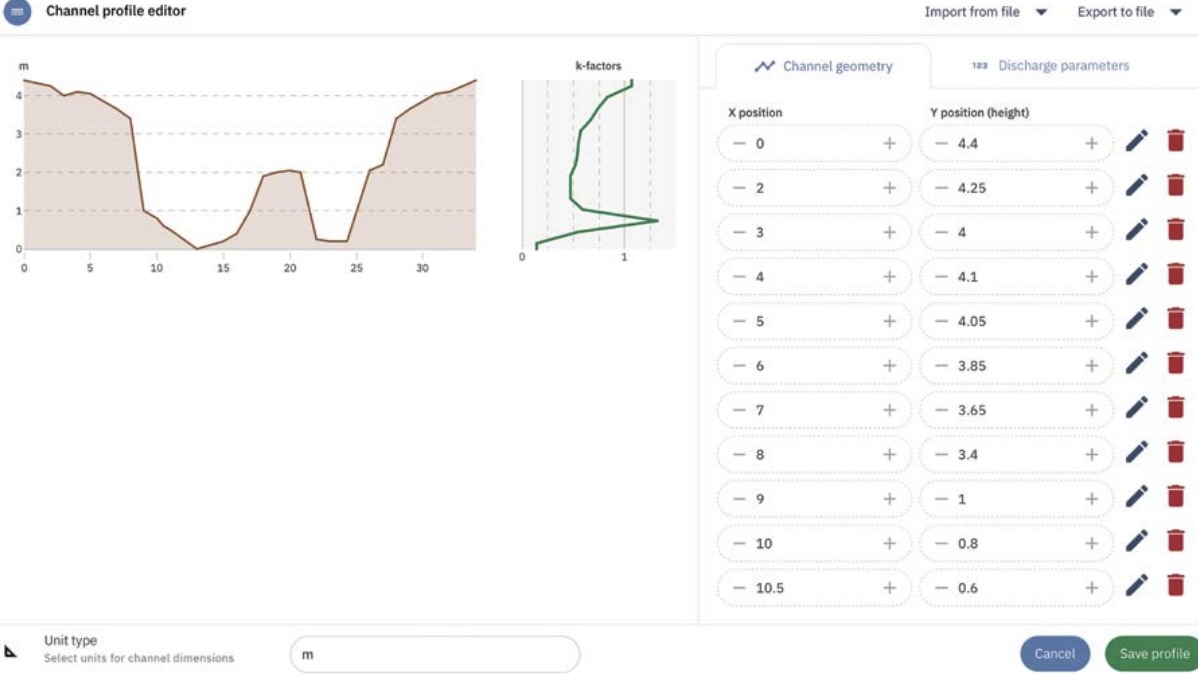
In complex environmental monitoring systems, on-site instruments cannot measure certain parameters directly. For example, river discharge can be estimated indirectly from water level using rating curves, or it can be determined by combining water level and surface velocity measurements. HydroView refers to these derived metrics as “Calculated Measurements.” The platform allows users to create custom scripts, or to use predefined scripts, that utilize one or more physical measurements, along with site-specific configurations (such as a site-specific rating curve), to calculate these additional parameters. Once calculated, these measurements are stored in the database alongside other physical measurements, providing a comprehensive data set for analysis and decision-making.
Examples of calculated measurements available in HydroView:
- Discharge from single surface velocity measurement
- Discharge from multiple surface velocity measurements
- Discharge from water level measurement at weir / flume
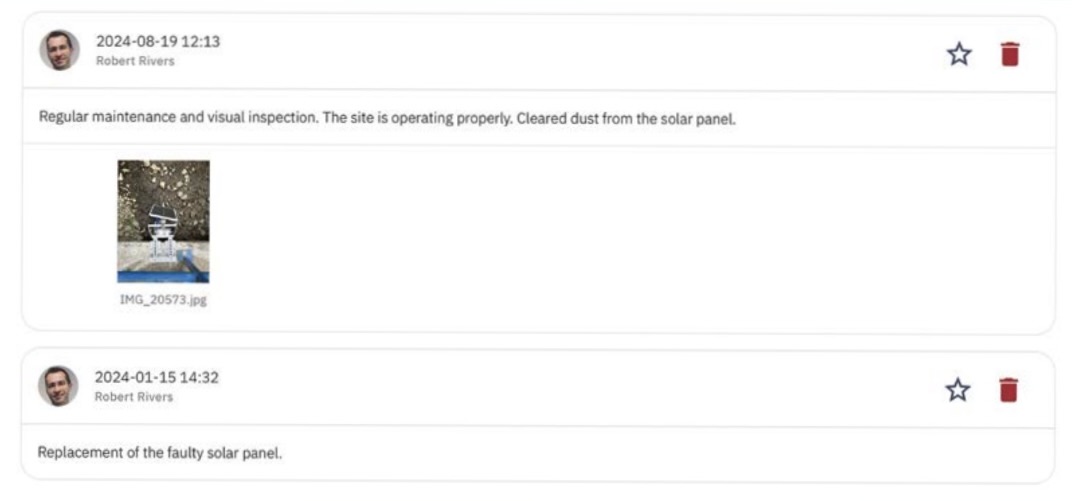
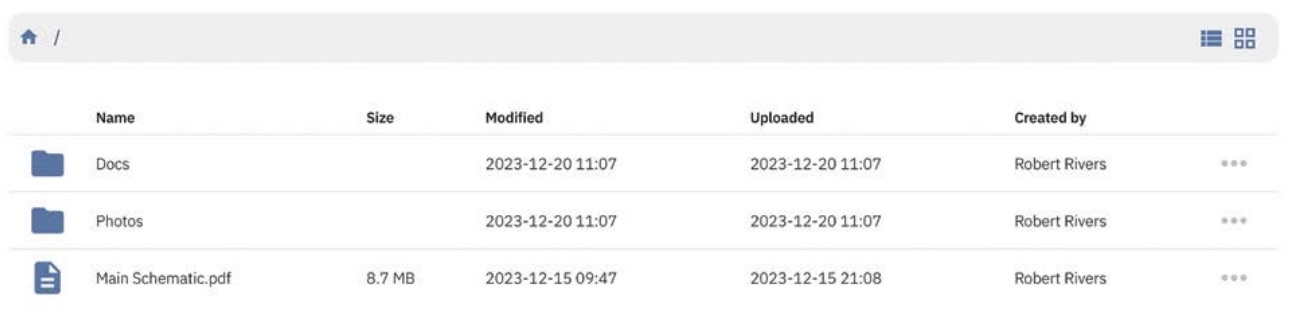
Keeping maintenance logs in HydroView is straightforward. Each monitoring site includes a dedicated Notes section where users with the appropriate privileges can add time-stamped notes, comments, and attachments to maintain a detailed record of equipment maintenance. Additionally, each station has its own Documents section, allowing users to upload supporting files such as site photos, equipment manuals, or site drawings in formats such as PDF. This functionality simplifies maintenance tracking and eliminates the need for a separate document management system to store documentation.
HydroView internally uses an optimized, embedded NoSQL database designed for high performance. The specialized NoSQL database ensures low latency for data access and rapid data load times, even when retrieving measurement data spanning several years. HydroView also supports decentralized installations with multiple server instances across different data centers. These instances are automatically synchronized, enhancing data access speed by connecting users to the closest server (similar to a CDN). Additionally, if one server instance fails, another automatically takes over, ensuring continuous operation. This redundancy is particularly important for critical systems, such as those used in flood protection.
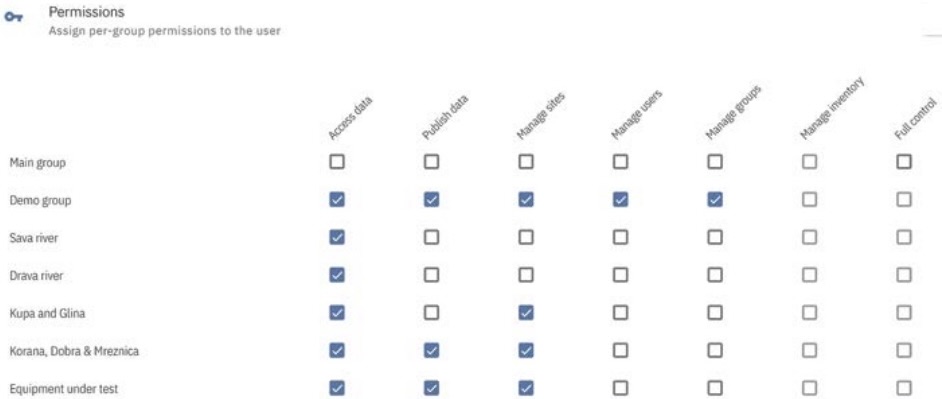
A user management system offered by HydroView is both simple and highly flexible. Monitoring stations are organized into hierarchical groups, similar to files and folders on a computer, making it easy to manage large numbers of sites. Each HydroView user can be granted specific permissions for each group, such as viewing data, adding new monitoring sites, changing site configurations, managing users, and creating new subgroups. This flexible approach makes HydroView suitable for organizations of any size, from small teams to large enterprises. For example, one of the largest HydroView users manages over 800 monitoring sites with more than 200 users accessing the system daily.
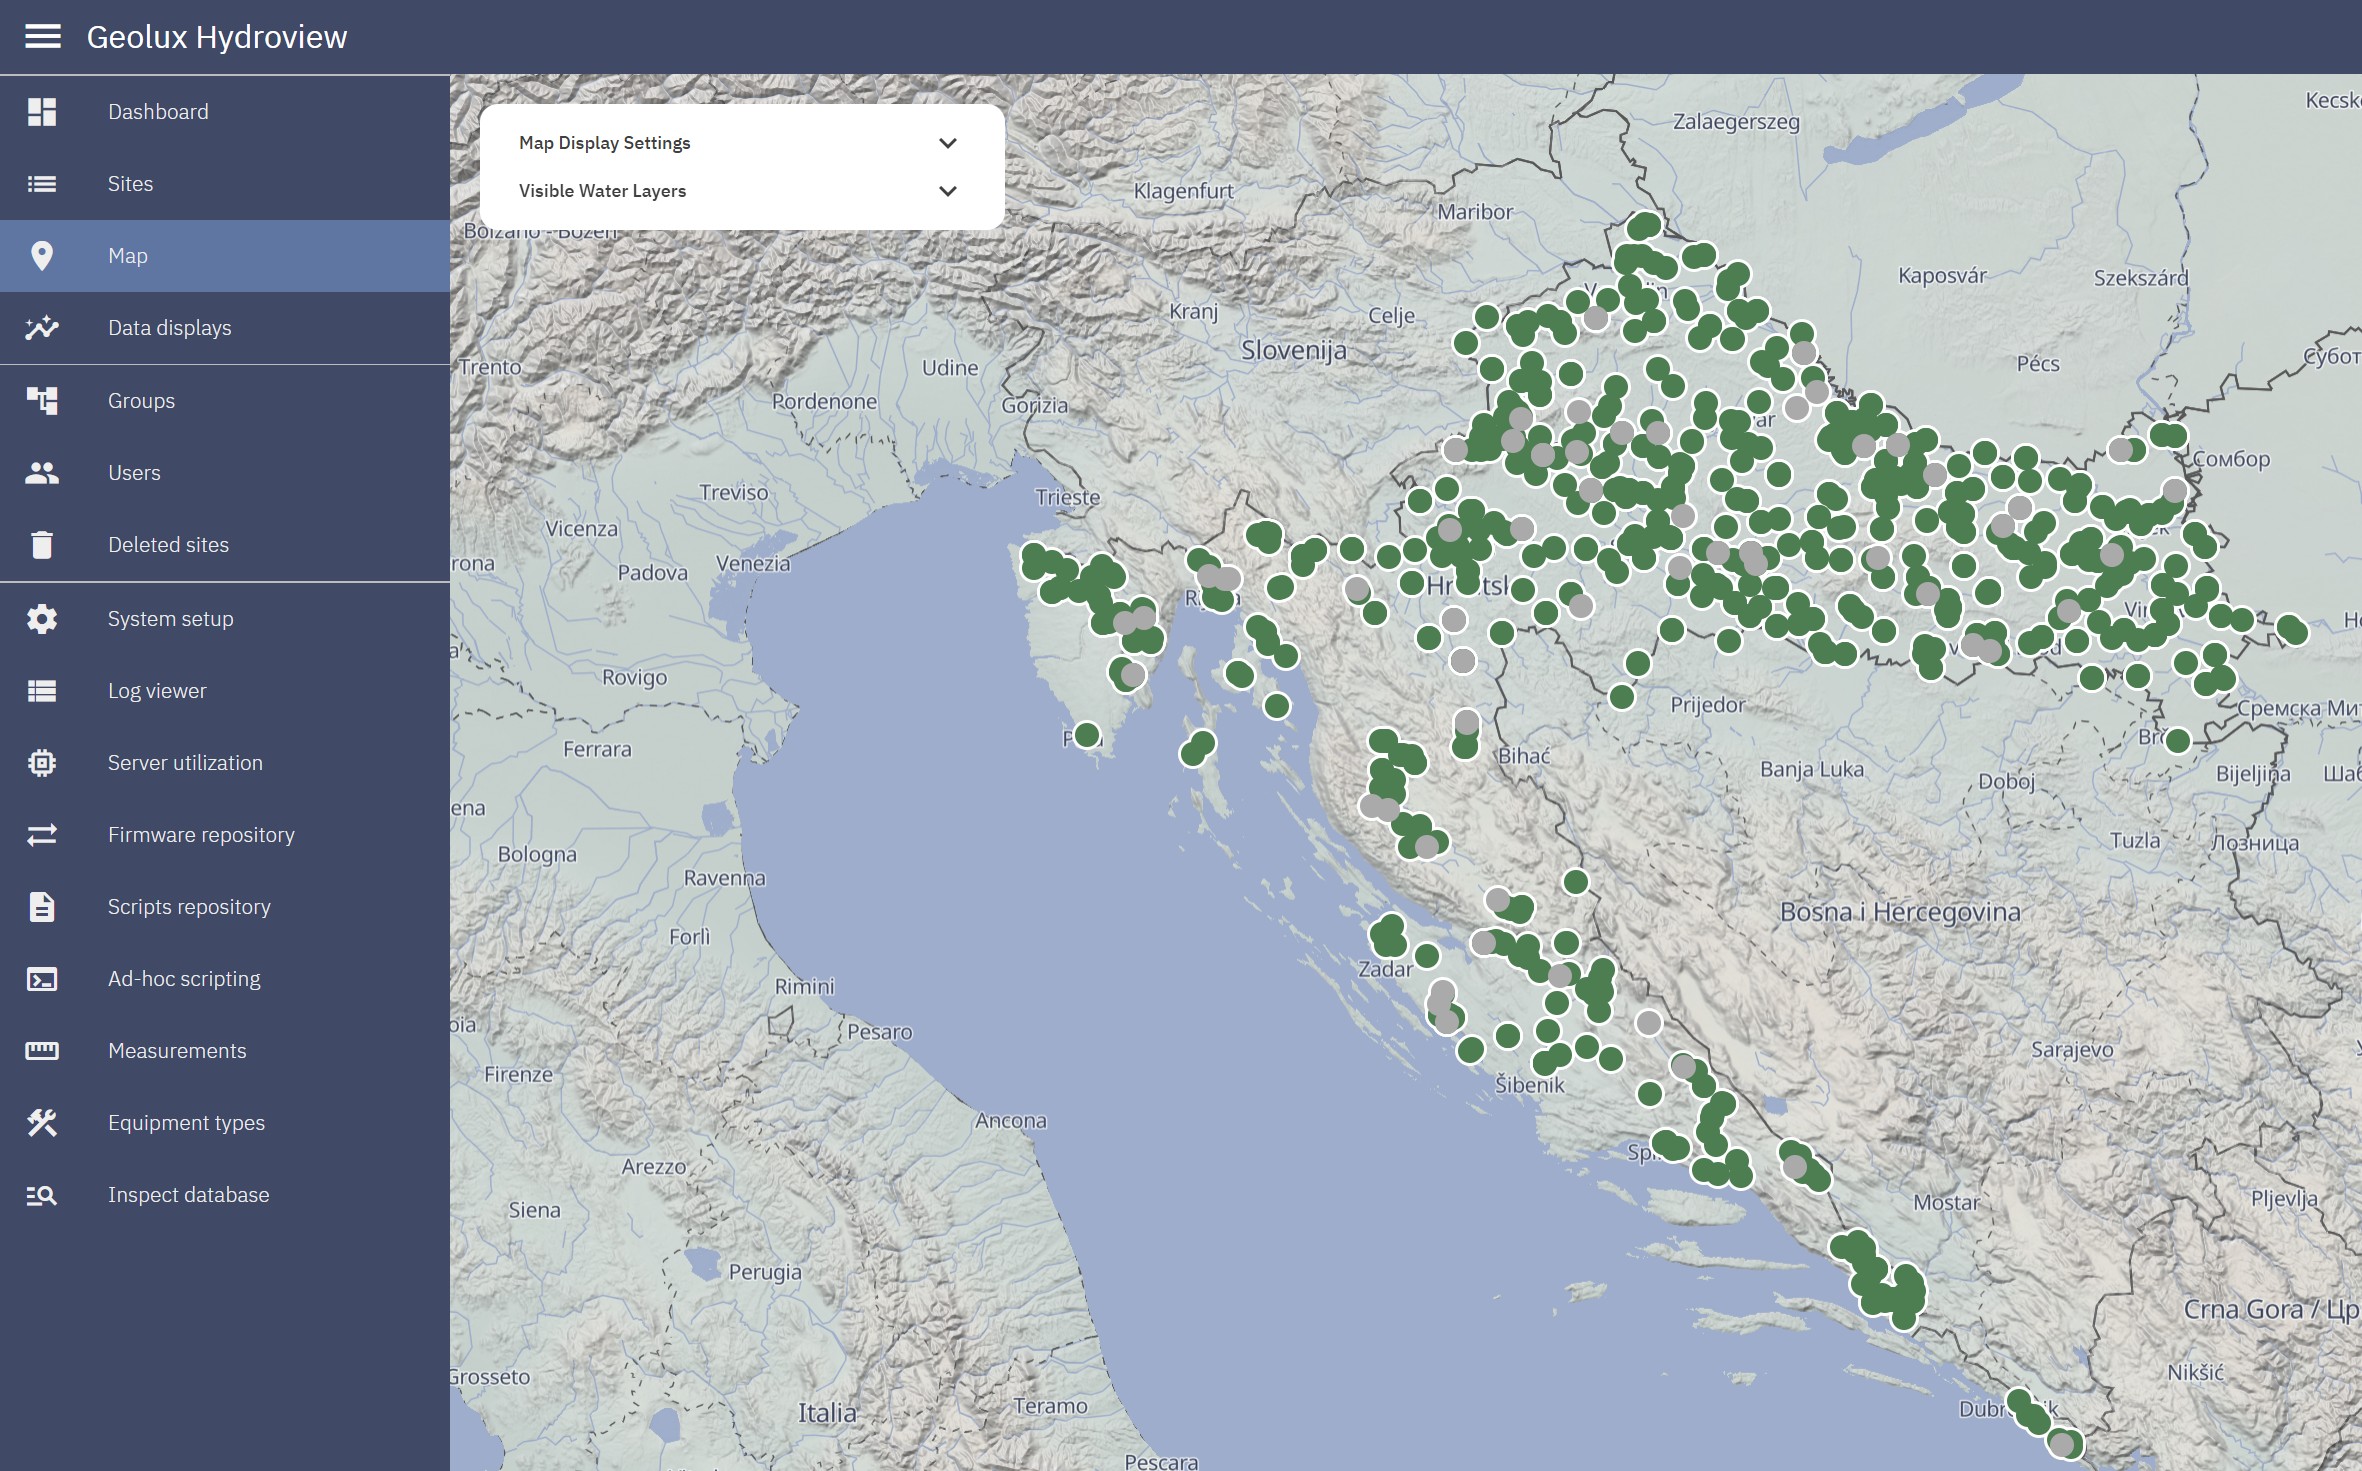
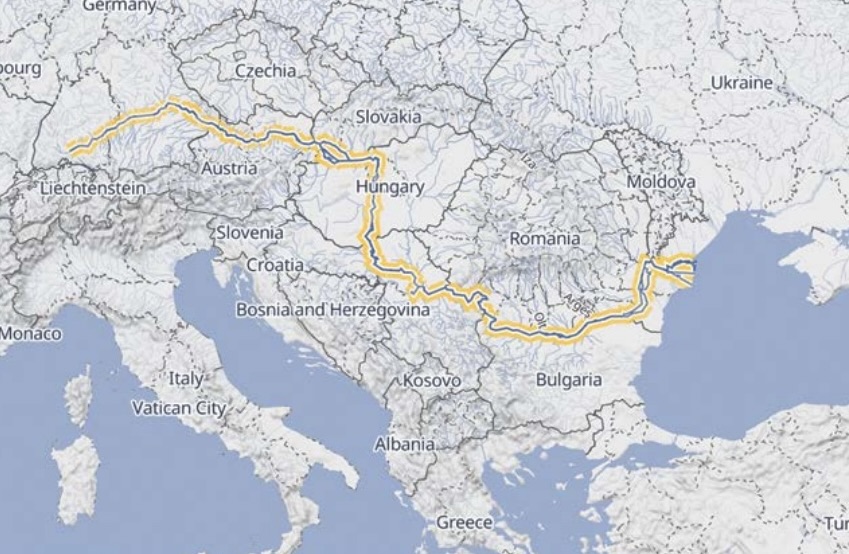
HydroView features a self-hosted map visualization system that operates independently of external map providers like Google Maps or Mapbox. This map view displays the locations of monitoring sites and allows for extensive customization by adding custom GIS layers. Users can easily toggle various map layers on or off, customizing the map view to their specific needs. A unique confluence-tracking feature enables users to click on any waterway on the map, automatically highlighting all waterways within the same confluence. This feature also traces the selected waterway to its final confluence with a lake, sea, or ocean, providing a visual understanding of the water network.
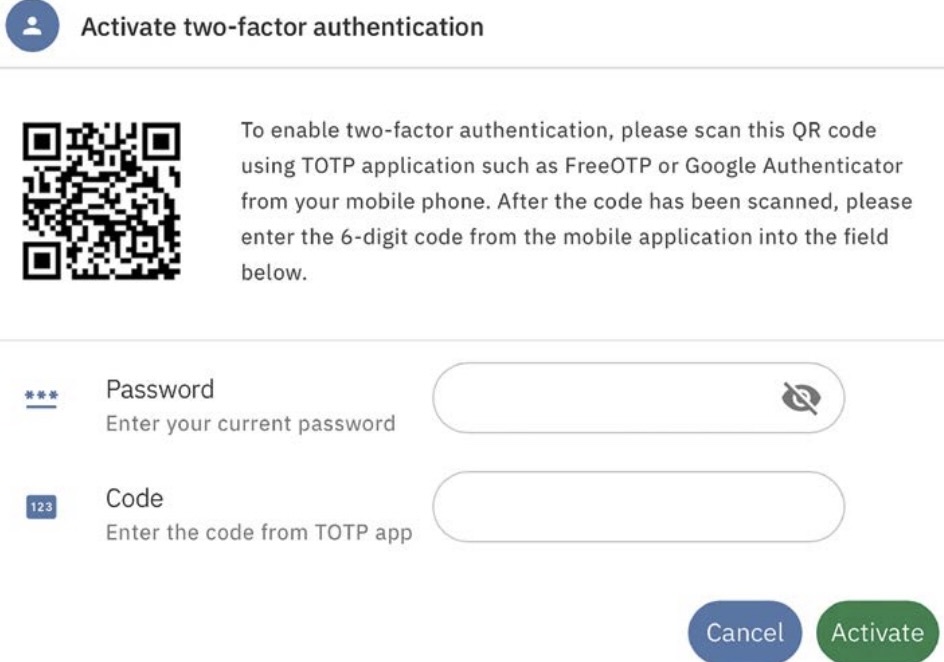
In developing HydroView, we placed great emphasis on creating a secure software system. With the rise of cybercrime, ensuring the security of a system used in critical situations, such as flood disaster management, is extremely important. Any form of sabotage could have severe consequences. To protect against this, HydroView incorporates robust security measures, including internal data integrity checks, two-factor user authentication, and rigorous quality control of software releases. These measures ensure that HydroView
remains reliable and well-protected against potential threats.